The panel on the bottom of the Hierarchy tab provides a schematic representation of the modeling workflow as a tree of projects. This graph diagram is built by the user and contains:
- the name of the Monolix projects
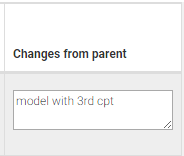
- changes from the parent project
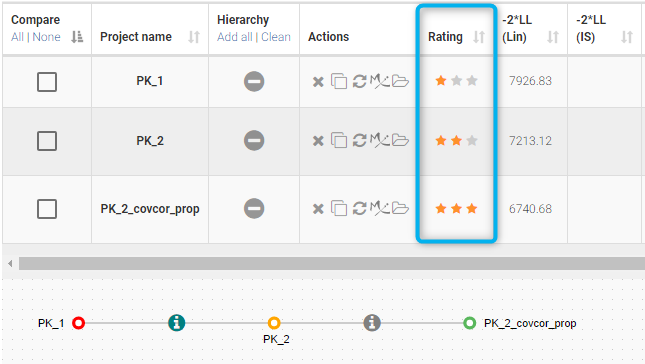
- the rating of the projects is displayed with a color code
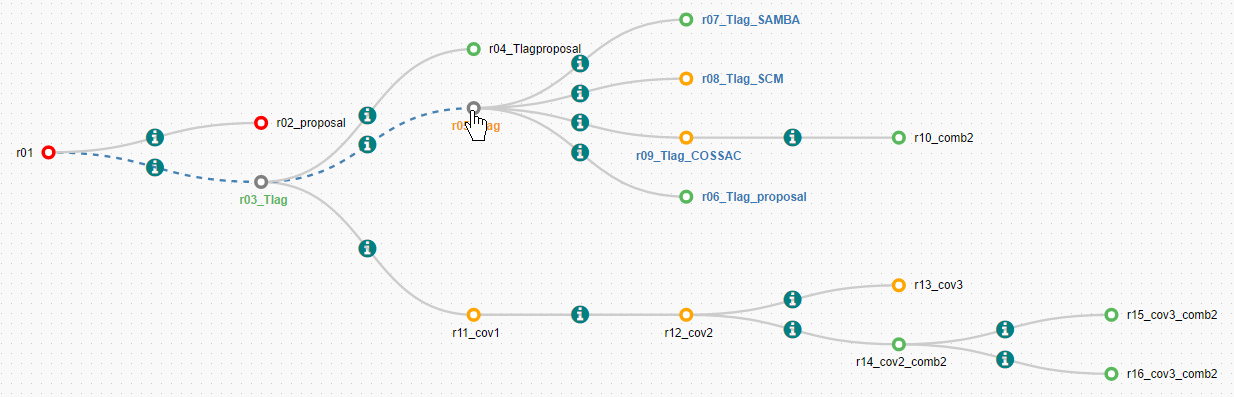
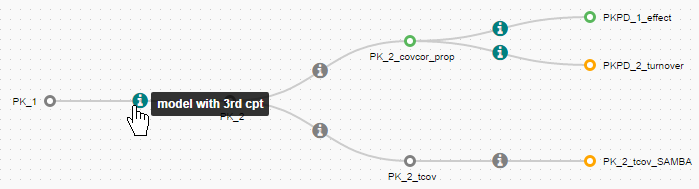
As seen on the figure above, hovering on a node of the diagram highlights its parent in green and its child(ren) in blue, on the diagram but also in the Selection panel and the Table of runs. The path to the root node is also displayed in dashed blue line.
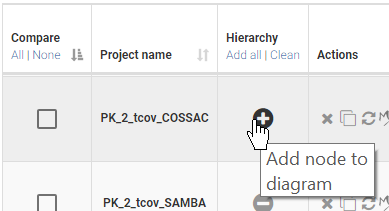
Building the tree representation
To build the tree representation of your workflow, use the buttons “Add node to diagram” (shown below) in the table of projects to add relevant projects in the tree view.
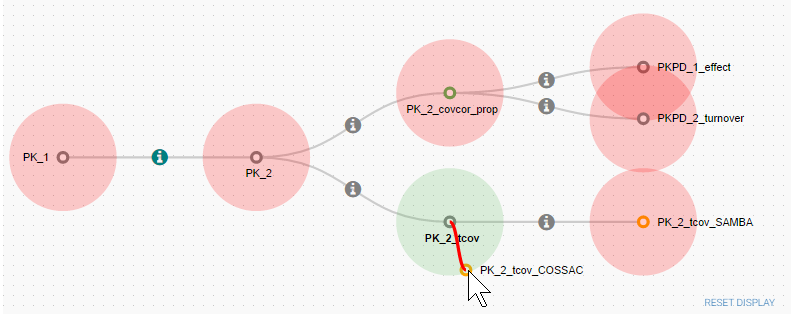
The projects are first added in the tree view as free nodes. They can be linked to a parent node via drag-and-drop. Available nodes are then highlighted in red, and the selected parent is highligted in green, as on the following figure.
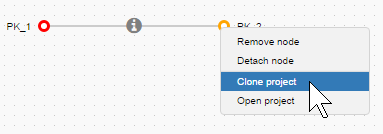
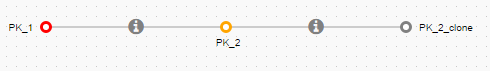
Cloning a project allows to create a copy of the Monolix project with a different name, that can then be opened in Monolix and modified. A clone is automatically added in the tree view as the child of the cloned project.
 |
➞ |
 |
Defining parent-child relationships
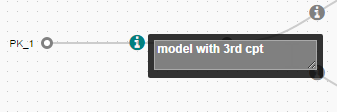
Changes from the parent project can be saved and displayed on the graph edges and in the table of projects.
| Two ways to define a parent-child relationship | Display on hover |
|---|---|
 |
 |
 |
Display of rating
The rating of runs set manually in the table of project is displayed with a color code on the tree view: red for one star, orange for two stars, green for three stars.
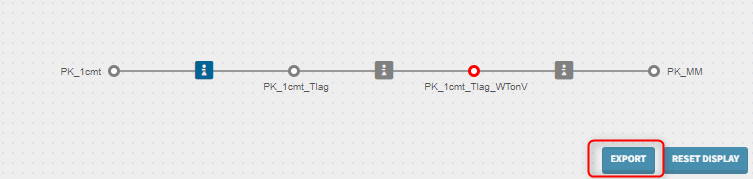
Export
Starting from the version 2024, it is now possible to export the tree as an SVG file by clicking on the export button next to the tree. The exported tree will be the same as the tree in the interface, however it will not contain the information icons.