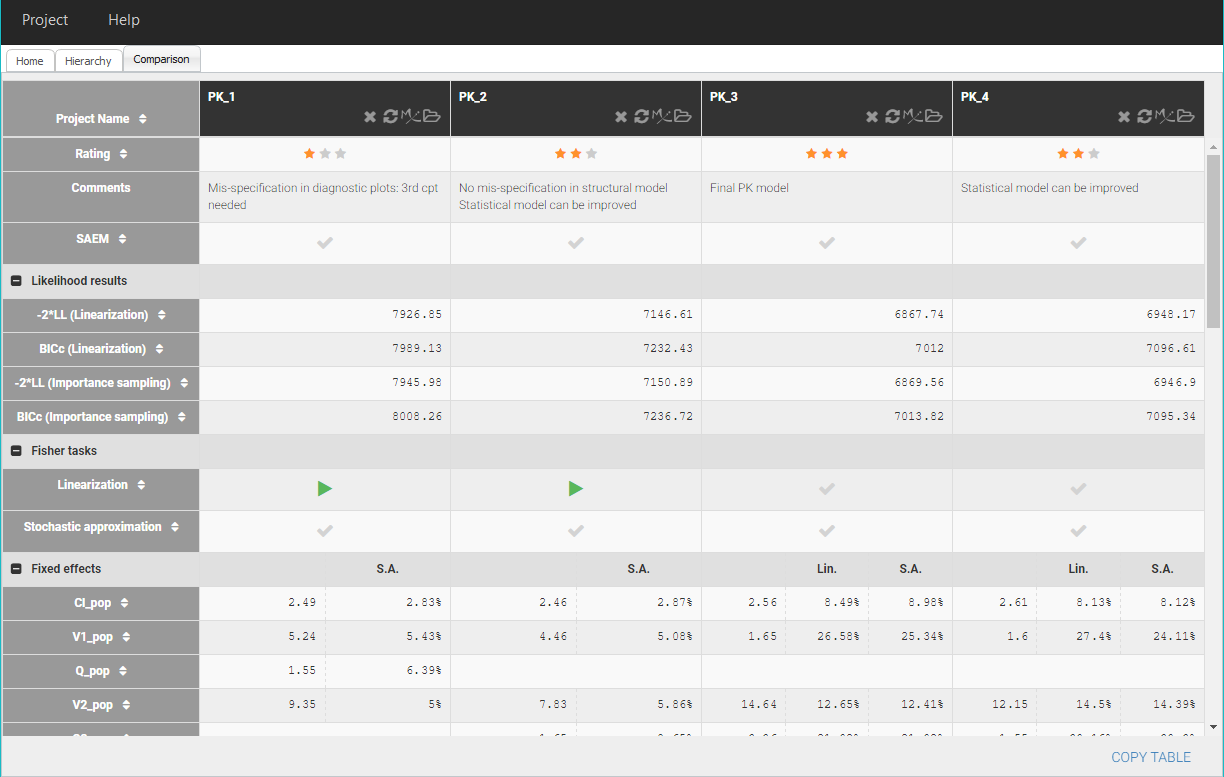
The comparison tab allows to compare side-by-side the main results of a set of Monolix projects selected in Sycomore.
Monolix projects are selected for comparison in the Table overview of the Hiearchy tab.
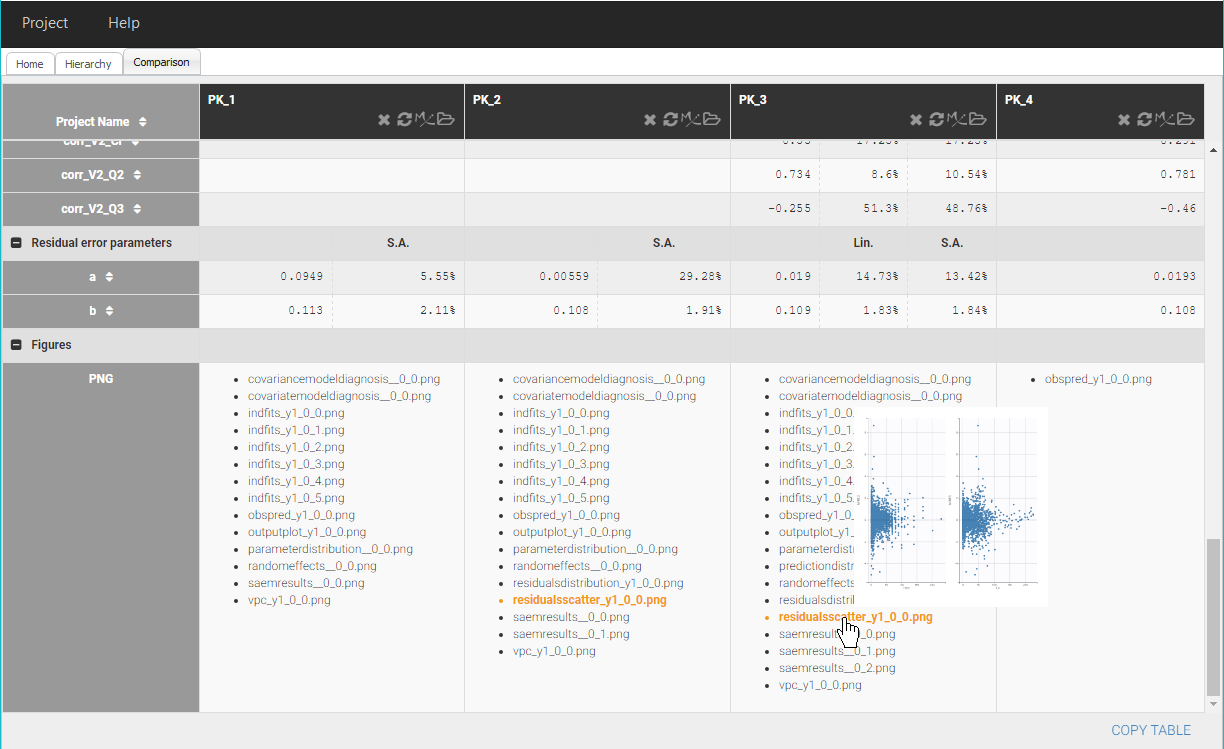
The results include:
- Project information:
- Project name
- Rating: the rating given to the projects in Sycomore. They can be changed on this table or in the Hierarchy tab.
- Comments: the comments saved in each Monolix project
- SAEM: this row indicates for each project whether the population parameters have been estimated.
- Likelihood results: the values of -2*LL and BICc based on the log-likelihood computed by linearization or by importance sampling
- Fisher tasks: these rows indicate for each project whether the Fisher information matrix by linearization or by sochastic approximation has been computed.
- Fixed effects: estimates and standard errors for the fixed effects (omega parameters)
- Standard deviation: estimates and standard errors for the standard deviations of the random effects (omega parameters)
- Residual error parameters: estimates and standard errors for the parameters of the residual error model
- Figures: diagnostic plots exported as png images
Here is an example of the table Comparison with 4 projects:
The table can be copied with the button ![]() on the bottom, to be pasted in any other software.
on the bottom, to be pasted in any other software.
Actions
Actions icons are available in the headers of the table, to perform useful actions: ![]()
Their functions are:
 Remove the project from the comparison table. This does not remove the project from the Selection panel nor theTable overview in the Hierarchy tab.
 Update the elements and results displayed for the project
 Open the project in Monolix
 Open the result folder of the project
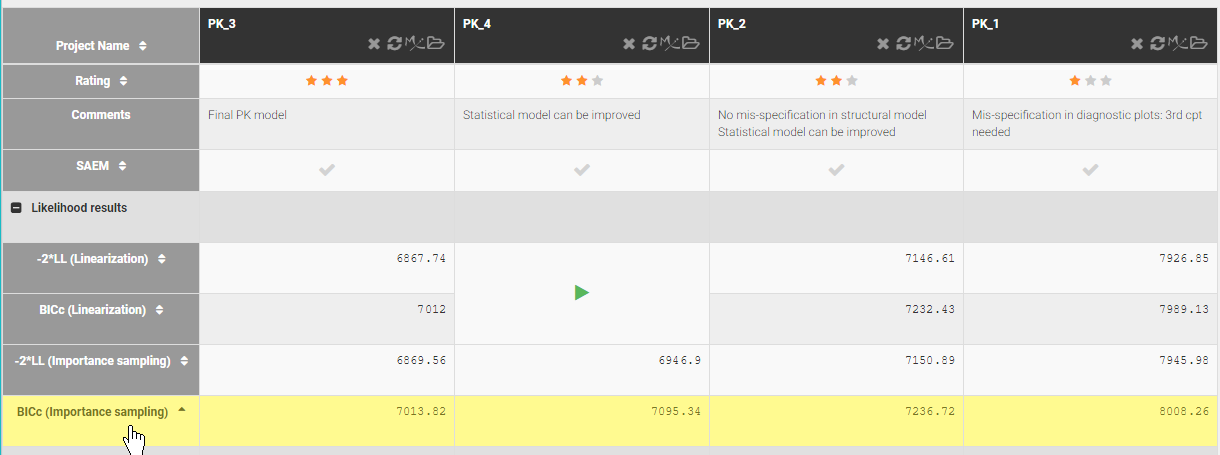
Sorting projects
Columns of the table can be reordered manually with drag-and-drop of the headers, or can be sorted in increasing or decreasing order according to the values of some row of the table, by clicking on the arrows next to the row names. Moreover, clicking on a row name colors the row in yellow to facilitate the comparison.
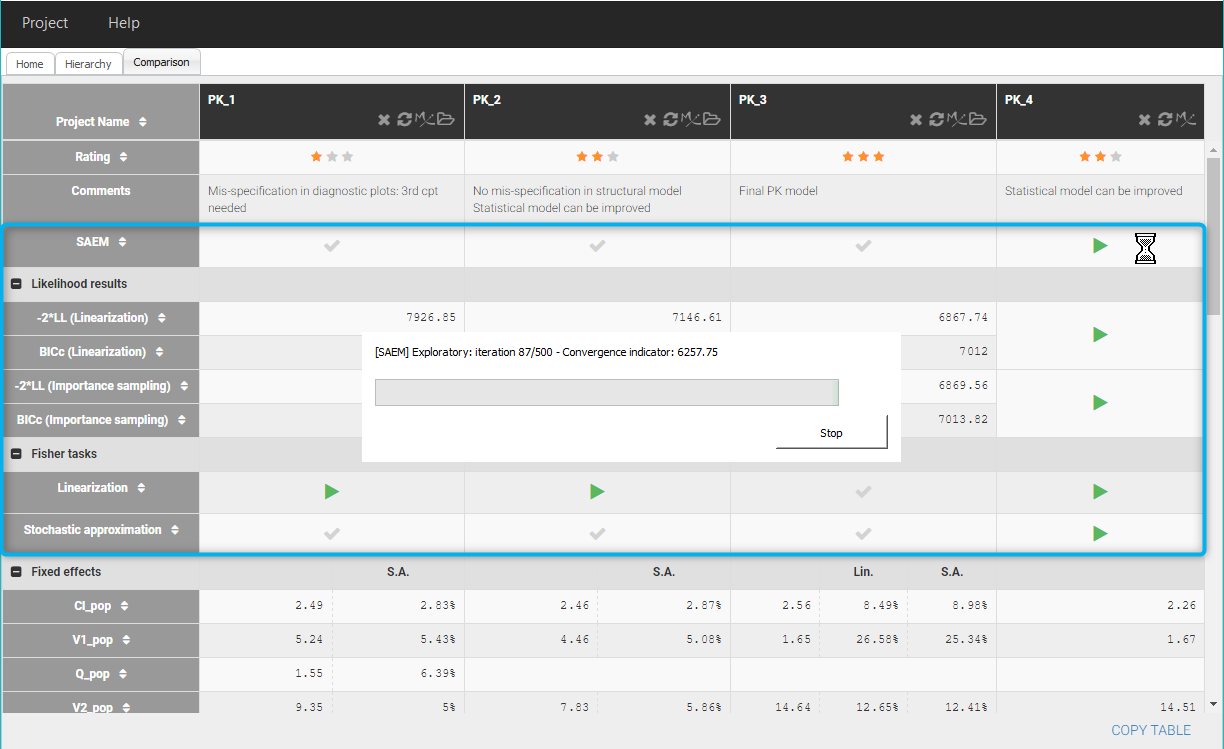
Running a task to get missing results
Some Monolix estimation tasks that have not run yet can be launched from the Comparison tab with the “Run” buttons (green arrow) to provide missing results:
- population parameters estimation with SAEM
- computing the log-likelihood by linearization or by importance sampling
- computing the standard errors with the Fisher information matrix by linearization or by sochastic approximation.
Comparing plots
For each project, diagnostic plots that have been exported as png images (this requires to generate the plots in the interface of Monolix and export them) are listed in the Figures section. Hovering on a file name colors the same diagnostic plots available for other projects, and displays a preview of the image.
Clicking on a file name opens a window where the corresponding plot from each project of the table is displayed with the name of the project.